Opening soon. The tool is finished and in final testing. Follow @SessionsAlphaNQ for the launch date.
The method
How it works
Two things have to happen, in order: liquidity is taken, and then price reverses back through the imbalance that taking it left behind. Everything else in the tool is either a way of detecting that more reliably, or a way of refusing setups that only resemble it.
Step one
Liquidity is taken.
Stops cluster. Every trader who is long has a stop somewhere under the recent low, every breakout trader has an order above the recent high, and nobody picks those places at random — they pick them by looking at the same chart, which has a small number of obvious levels on it.
A participant who needs to fill a serious position has a problem: there is not enough resting supply at the current price. What they need is a moment when a lot of people are selling at once. A cluster of stops under an obvious low is exactly that.
So price goes and gets them. A sharp move below an obvious low is not a breakdown. It is a purchase. Once those orders are gone there is nothing left underneath to push price lower, which is why the reversal off a sweep is so abrupt.
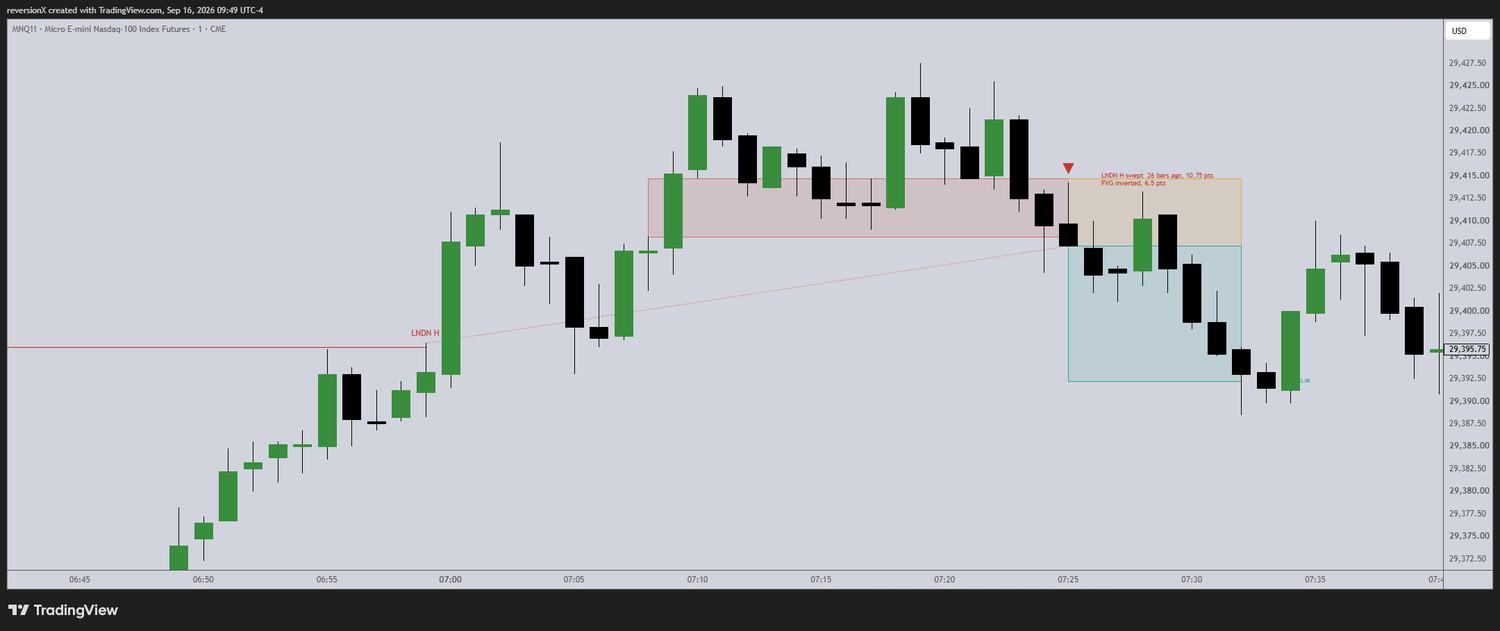
The whole sequence in one frame. The London high is taken at 07:00, price rolls over, and at 07:25 a candle closes back down through the gap the rally left behind. The dotted line runs back to the level that was taken; the caption reports it was 26 bars and 10.75 points ago.
Step two
The gap inverts.
Take any three candles in a row. Normally the range of the first overlaps the range of the third — price moved, but it moved through every level on the way, and trading happened at each one.
A fair value gap is when they do not overlap. The middle candle moved so far and so fast that there is a band of prices where effectively no two-sided trading took place. It is a footprint of urgency — nobody creates a gap with patient limit orders — and it leaves orders unfilled on the other side.
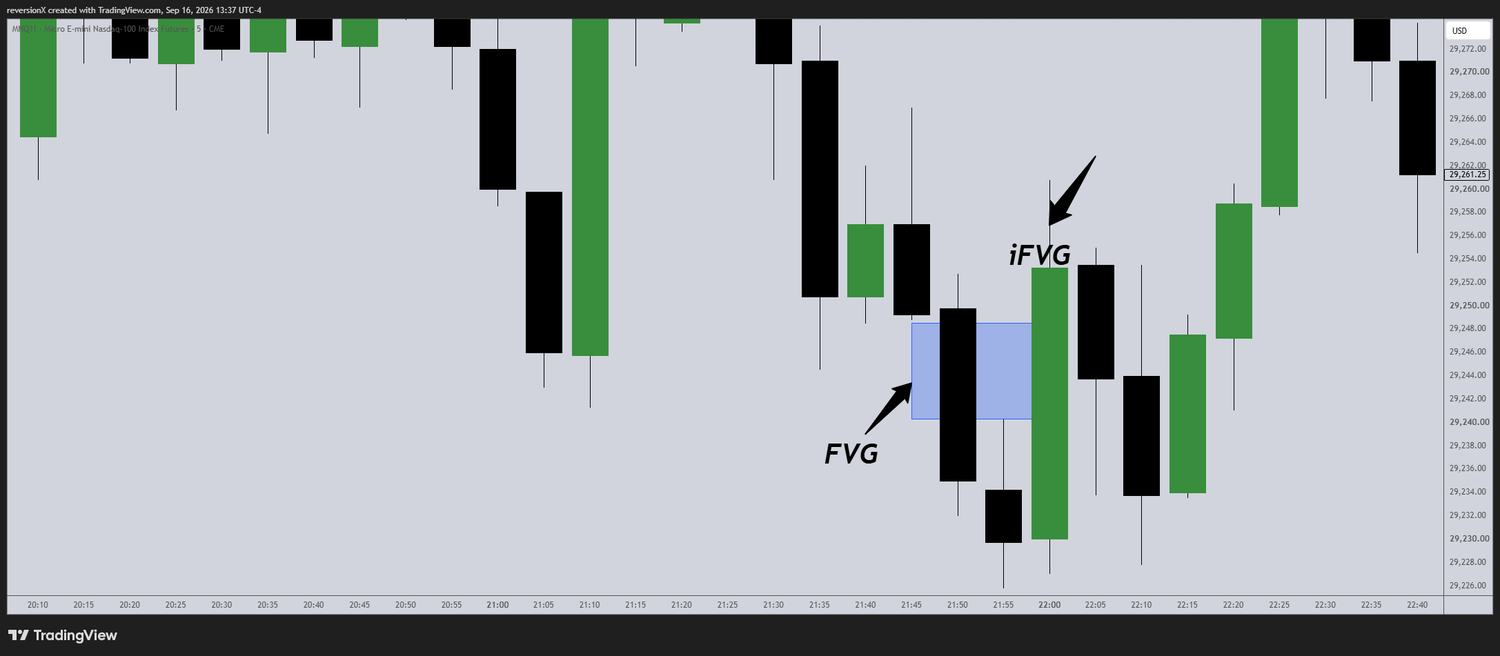
The shaded band is the gap: the high of the first candle sits below the low of the third, so between them nothing changed hands on both sides. A few candles later price closes back up through it. That close is the inversion.
Why the inversion matters
A bullish gap is supposed to act as support. Price returns, the buyers who missed the move step in, price turns back up. That is the base case.
The interesting case is when it fails. If price closes all the way through and beyond it, every one of those buyers is wrong. They are underwater, in a zone they themselves marked as important. Their stops sit just beyond it. And when price trades back into that band they take the chance to get out at breakeven — they sell into the retest. Support becomes resistance.
Nothing mystical about it. Trapped traders defending their exit, which is the same mechanic that makes a broken trendline act as resistance.
And this is the part that does the work. At the moment price trades below an obvious low you cannot tell a stop run from a genuine breakdown — they look identical. The difference only appears afterwards, in what price does with the imbalance it created on the way down. If it closes back through, the sellers who pushed it there are trapped and it was a sweep. If it does not, it was a breakdown and you were right to stay out.
Both halves
Either one alone is weak.
A sweep with no inversion is a guess at a low. An inversion with no sweep can happen anywhere on the chart and tells you nothing about why price should reverse from there. Together they describe one complete sequence: the liquidity got taken, and the people who took it are now trapped.
Bar replay of the Sweep model. Notice the marker does not appear when the high is taken — it appears once a candle has closed back down through the gap. That delay is the whole design.
Two models
The same idea, detected two ways.
Sweep model
Watches individual levels
When a level is traded through, the model arms in the opposite direction and starts looking for a gap to invert. The caption names the level that armed it, so "ASIA L swept 12 bars ago, 8.5 pts" tells you which low was taken, when, and how far price has travelled since.
Session highs and lows
Hourly liquidity pivots
Previous day and week extremes
Runs on any timeframe
CRT model
Watches a session range
Records the high and low of a window — 7:00–8:00pm, say — then waits for price to close beyond one edge and back inside. Same sweep, framed as a range rather than a line.
Six configurable time windows
Turtle soup confirmation, optional
Inverted FVG confirmation, optional
1-minute charts only
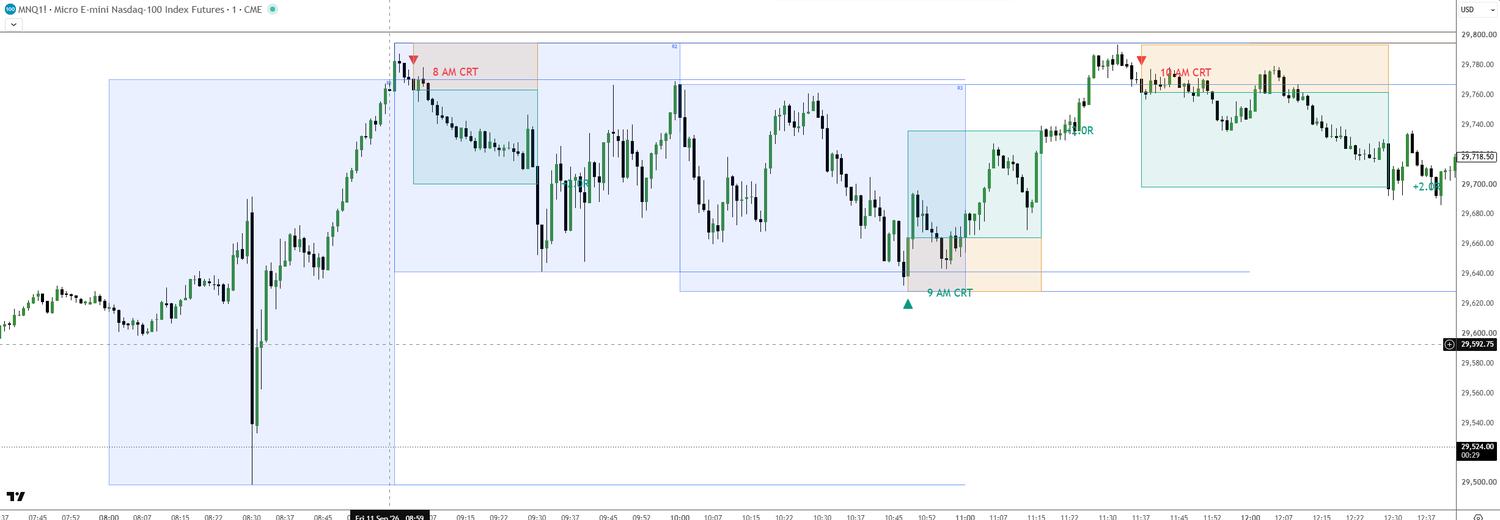
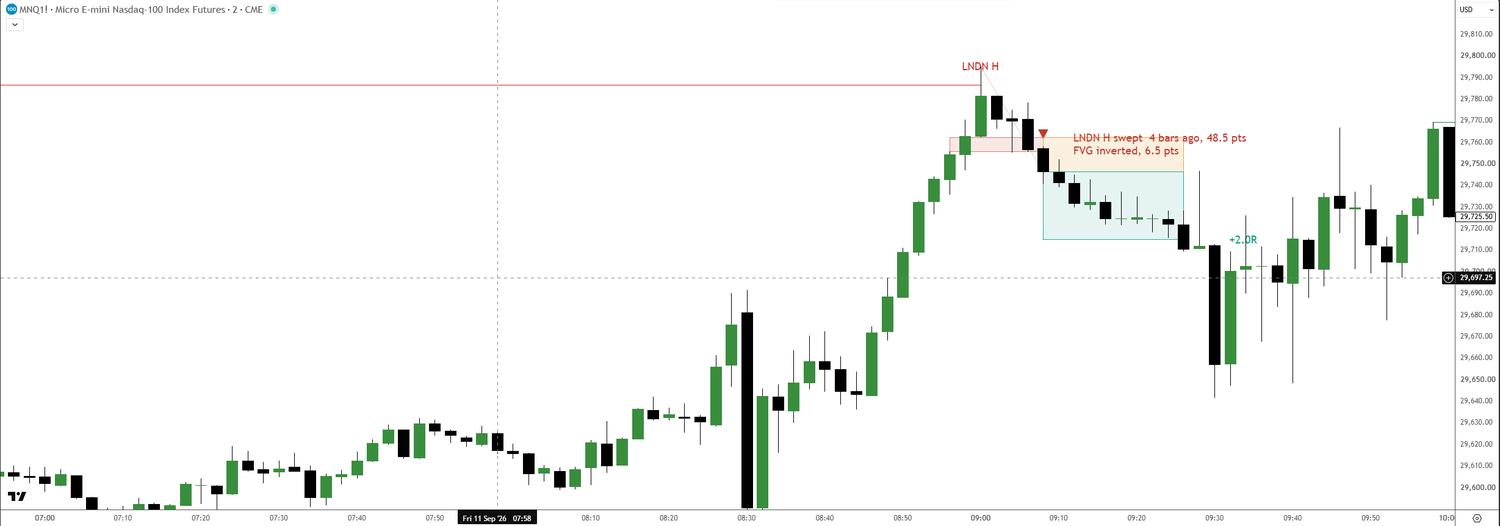
Three CRT setups in one New York morning — the 8 AM range short, the 9 AM range long, the 10 AM range short. Each range is watched independently, and two of the three went the opposite way to the one before it.The Sweep model on a 2-minute chart. The London high is taken, price reverses, and four bars later a candle closes back down through the 6.5-point gap the rally left behind. The tool has no directional preference.
On the chart
Every signal tells you why it fired.
No black box. Each marker carries the level that armed it, how long ago, how far price has travelled since, and the size of the gap that inverted.
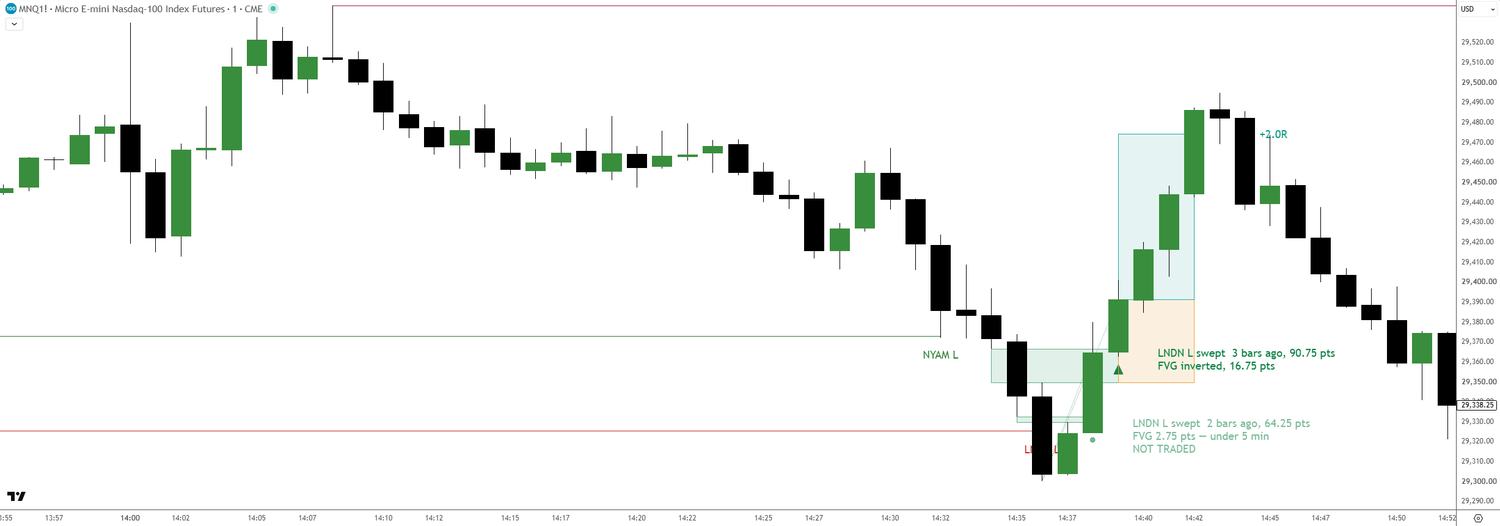
Solid triangleA setup that met every requirement. Opens a tracked trade and sends an alert.
Dimmed dotA gap that inverted correctly but came in under your minimum size. Shown so you know it happened. Never trades, never alerts.
Shaded bandThe fair value gap that inverted, drawn from where it formed to where it flipped.
Stop and target boxesDrawn at entry, closed at the exit, with the R outcome printed beside them.
Link linePoints back to the exact bar and price where liquidity was taken, long after the level itself has cleared the chart.
Two setups off the same London low, two bars apart. The lower one inverted a gap of just 2.75 points — under the minimum — so it draws as a dimmed dot reading NOT TRADED. The one above cleared it at 16.75 points and took the trade. You see what was filtered out and why, rather than a silence you have to trust.
Read the first five sections free
Philosophy, market reality, why liquidity pools where it does, and fair value gaps explained from first principles. About twenty pages of the strategy guide, sent as a PDF. No tool required to read it, and nothing in it depends on subscribing.
One email with the PDF, then occasional notes on the method. Unsubscribe any time. wire form to MailerLite / Kit