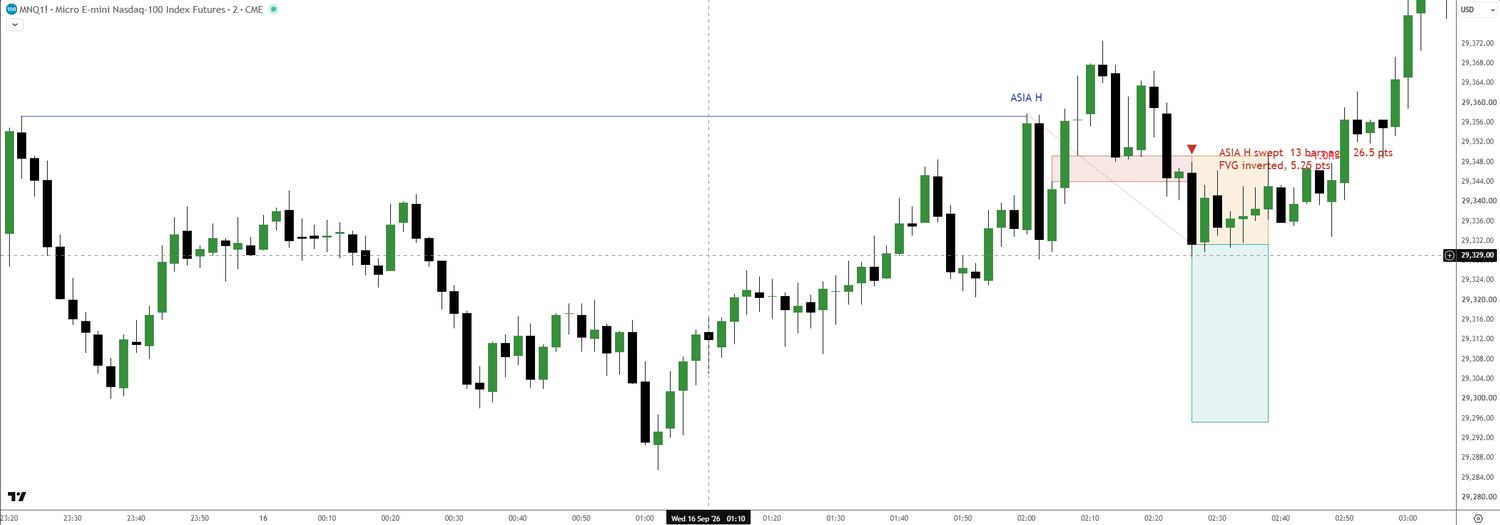
A sweep is a purchase, not a breakdown.
Every trader long has a stop under the recent low. Nobody picks that place at random — they pick it off the same chart everyone else is looking at. So orders pool in dense clusters just beyond the obvious levels, and anyone who needs to fill real size has to go and get them.
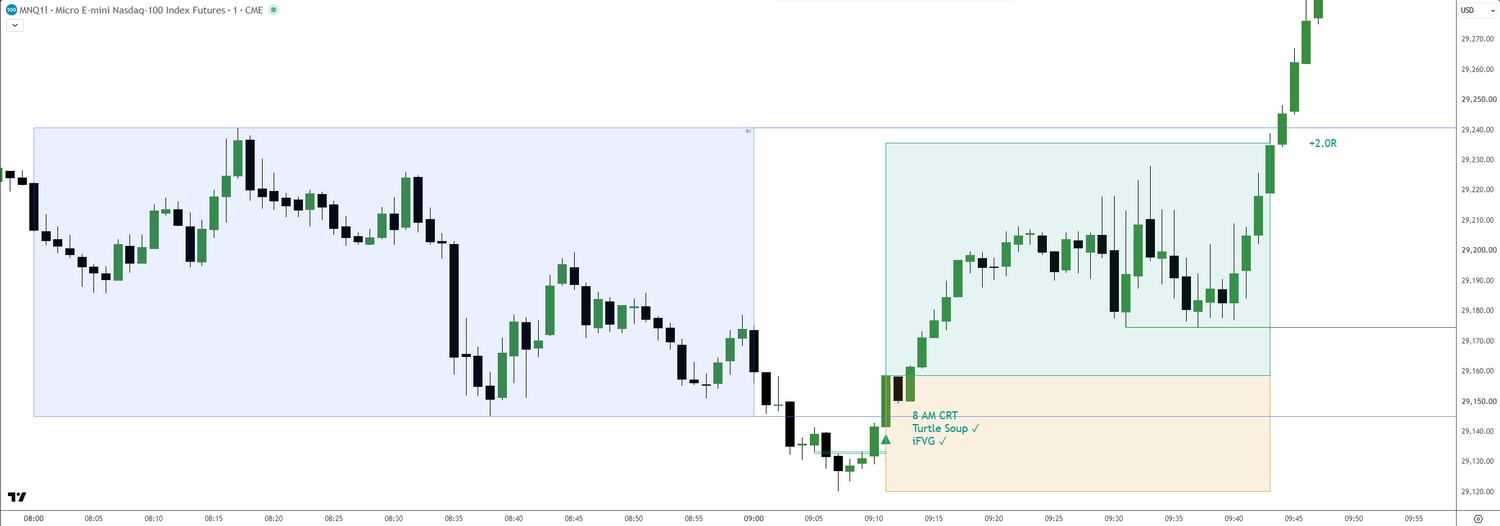
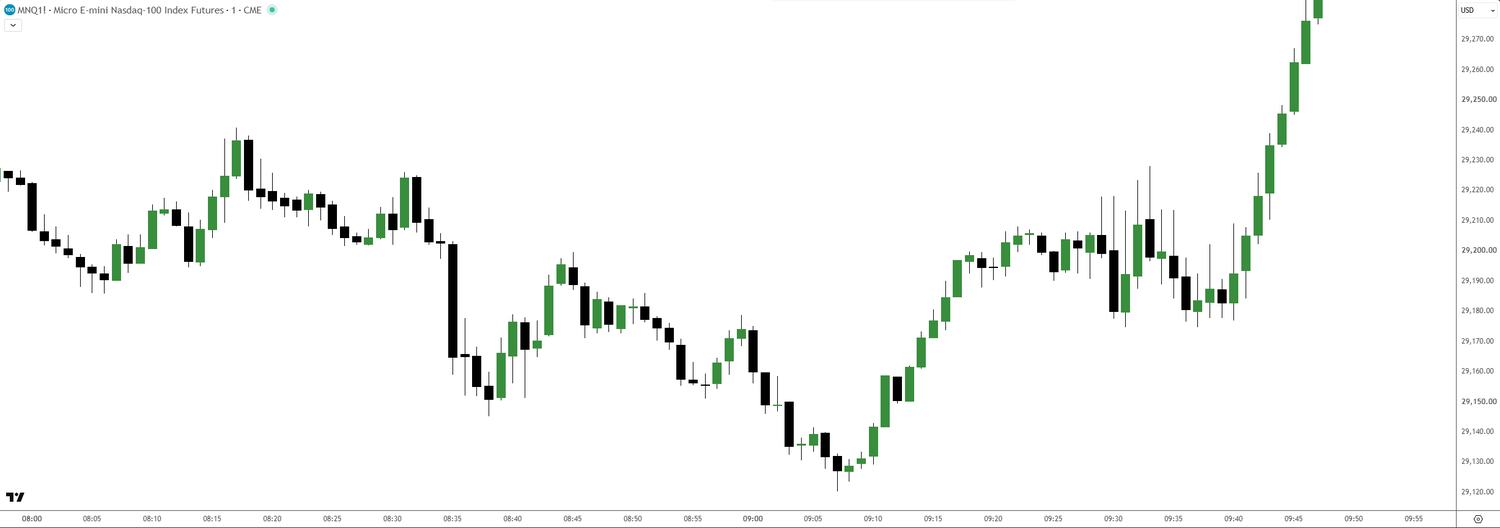
Drag the handle. Same chart, same minute. On the left, a low at 09:08 that looks like any other low. On the right, the range that was swept, the confirmations that fired, and where the trade was invalidated.
The hour before
Price chops sideways and builds a range. That chop is not boredom, it is stops accumulating on both sides of an obvious level.
The open takes it
Volume arrives on a schedule. Price runs through the level, fills the resting orders, and there is nothing left underneath to push it further.
The gap flips
The aggressive move left an imbalance. When price closes back through it, the traders who caused it are trapped. That close is the entry.
At the moment price breaks an obvious low you cannot tell a stop run from a real breakdown — they look identical. The inversion is the first thing that distinguishes them, which is why the tool waits for it instead of guessing at the low. The full sequence →